
simplified. visualized. utilized.
Your student data
I turn fragmented data from your SIS, LMS, attendance, and assessment platforms into intuitive dashboards so you can stop running reports and start driving student improvement.


You have a wealth of data about your students, but it’s just sitting in spreadsheets or stuck in disconnected platforms.
Admin and grade level/department teams are drowning in data but starved for insight.
The time and energy needed to make the data more usable is more than you have to give.
Your teachers find data discussions frustrating because the visualizations aren't built with their workflow in mind.
Identifying students who need Tier 2/3 supports is slow, manual, and often reactive.
Attendance data isn’t being used to spot early warning signs.
The Datafied Classroom was created with you in mind.

I'm Tom, and after nearly 20 years in education, including 12 as an IB math teacher, I realized the greatest roadblock to student growth wasn't a scarcity of data, but time to make effective use of that data. I know about the issues listed above, because I experienced and felt all of them. Even as a math teacher, I didn’t have the time or energy to get the most out of all the data I collected on my students.
So now I’ve created The Datafied Classroom to help teachers, coordinators, and administrators make sense of any student data, whether it’s IB results, attendance trends, literacy benchmarks, or MTSS progress.
My driving purpose is trying to make educators lives easier, without giving you all more work to do. I take the teacher’s perspective first, because if they aren’t using the data collected and given to them, then informed change can’t be made to help students improve. But I also make sure the analysis that administrators need is also present or accessible.
Realize the power of visualized, interactive graphs to inform school and classroom decisions.
No two schools (or grade level cohorts) are alike. But looking aggregated data points and trends across multiple domains can help you target areas, or groups of students that might need some extra attention to help them achieve greater success.
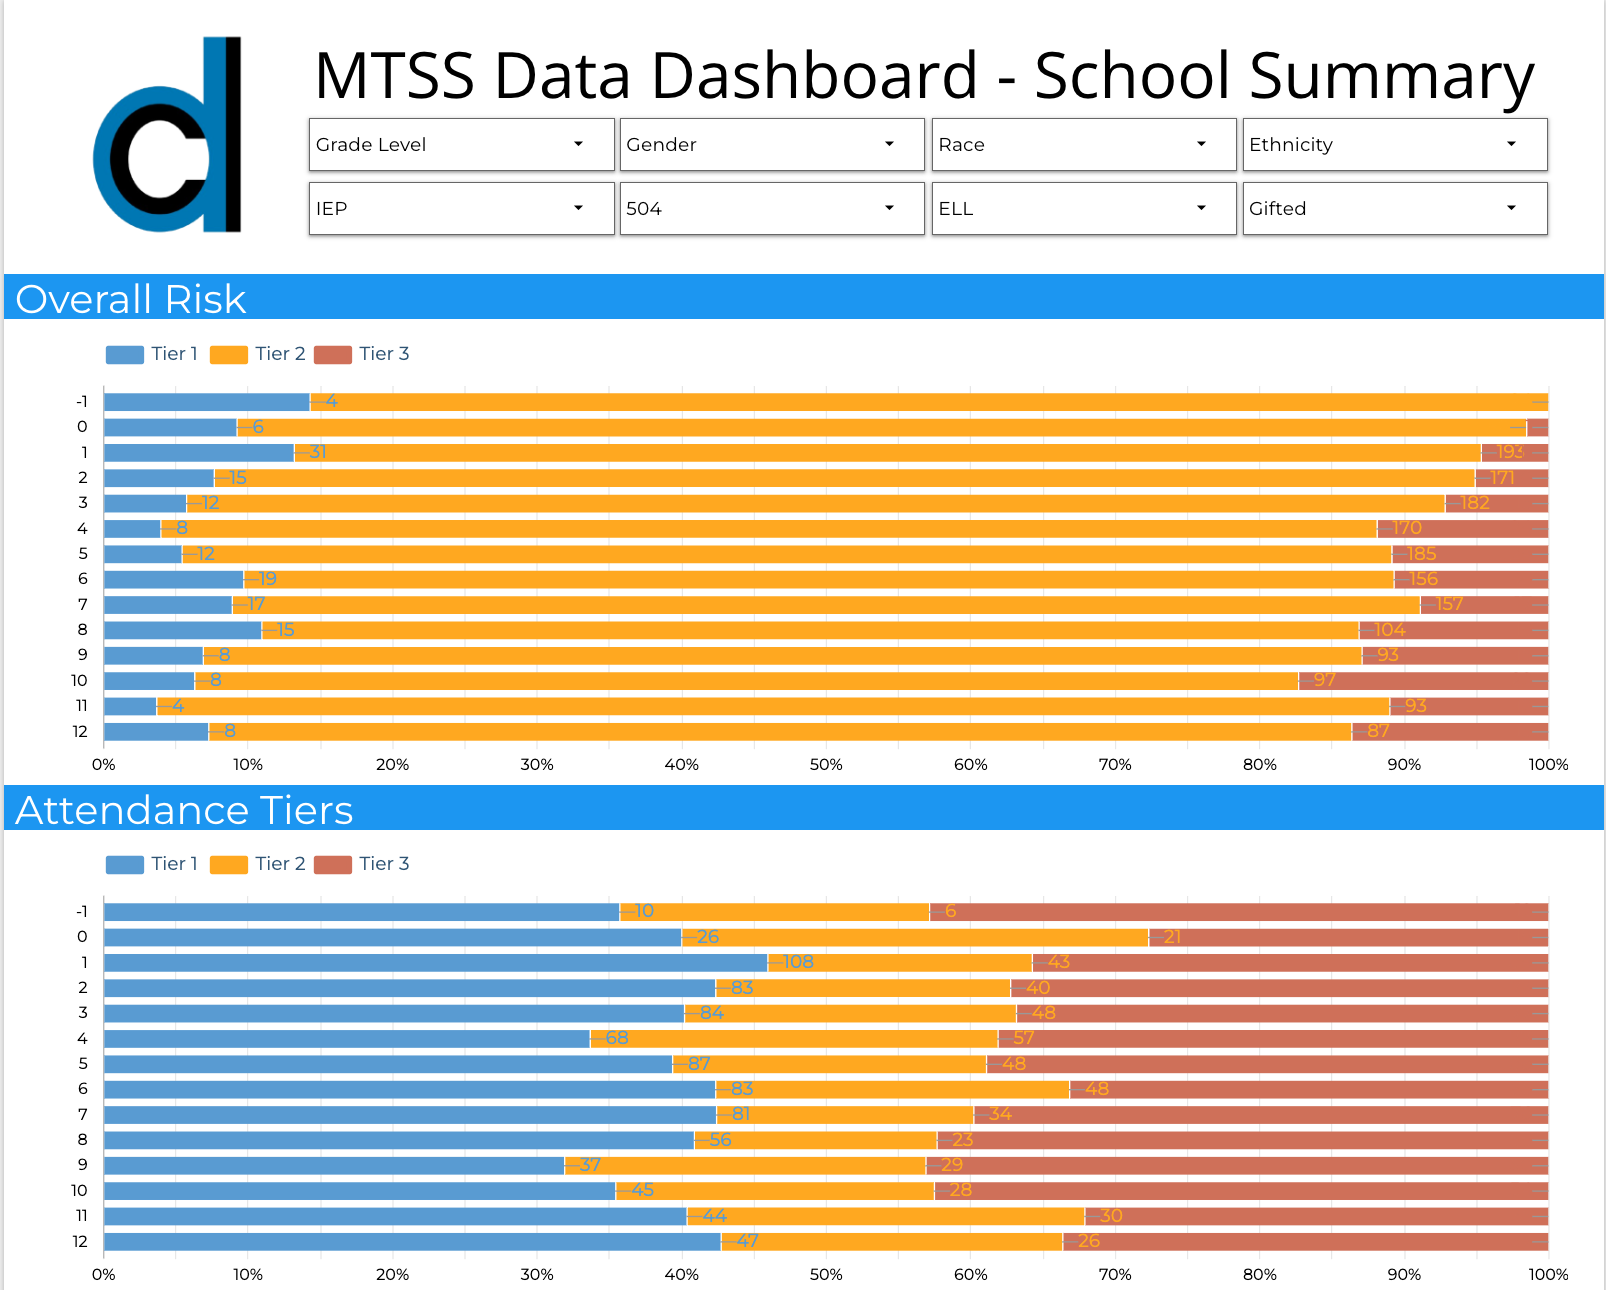
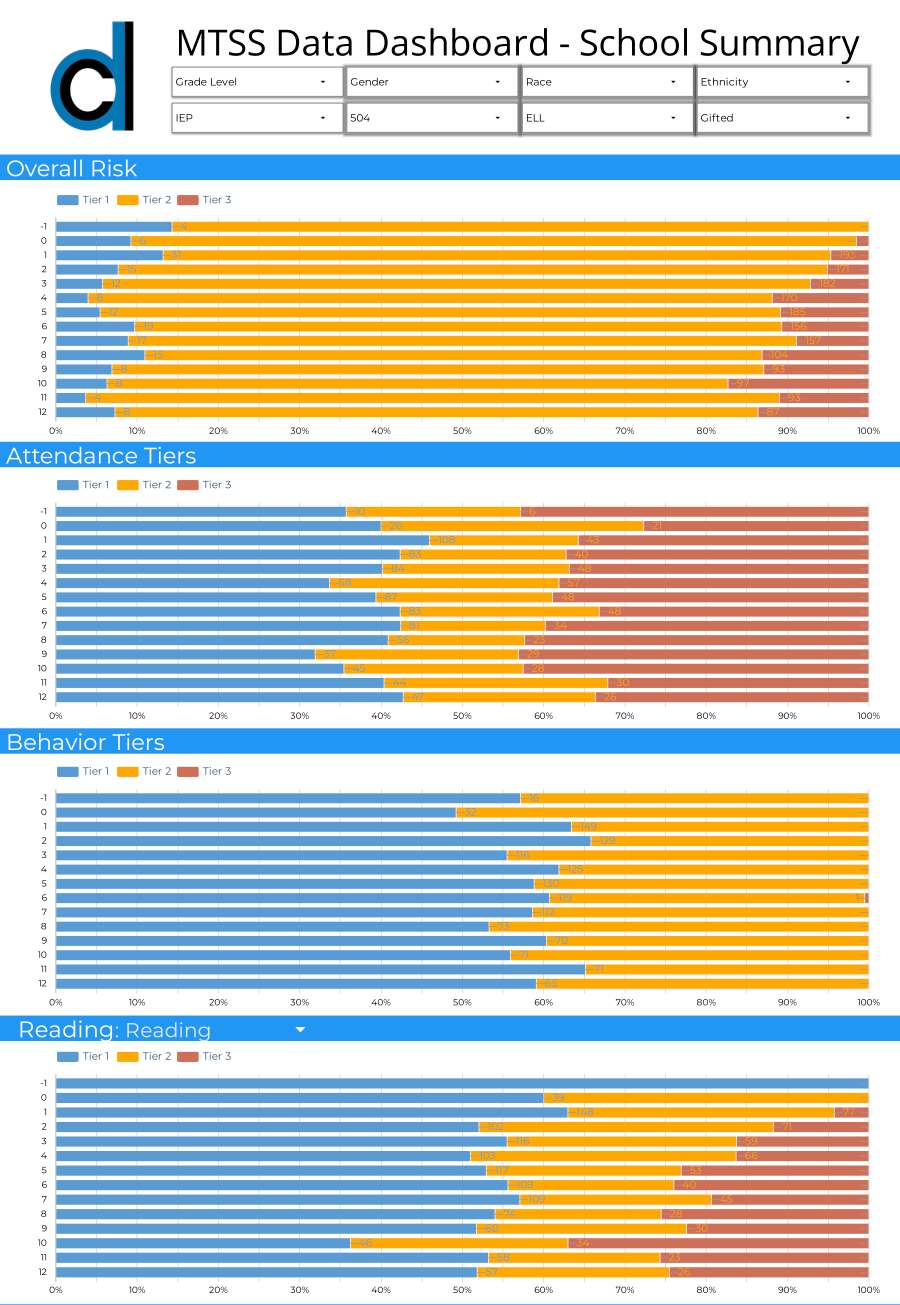
MTSS Overviews

Multi-Tiered Systems of Support help you see intervention needs by school, grade level, or demographic by aggregating all the key data that impact a student’s success: attendance, behavior, and academics.
Attendance Trends
See how grade levels or schools compare to district attendance levels. Break down attendance issues by student demographics and get lists of students who are at risk or who are excessively truant.

Academic Deep Dive
Do a deep dive into assessment data (like IB exam results). Look at subject and component performance for an individual year or trends over the last 5 years.
How does it work?
Book a call. This is so we can discuss the specific needs or requests you have.
1
I get to work. You send me your data files (IB results, attendance, MTSS, or anything else) and I build a dashboard that fits your school’s needs.
2
Enjoy the fruits of my labor. You receive an intuitive, easy to understand data dashboard that any of your teachers can use and understand.
3
Here's what educators are saying.
FAQ
-
First - We have a brief (30-45 minute) call discussing your wants and needs and any other customizations you want.
Second - You collect the data you want in your dashboard and send them over to me.
Third - I get your dashboard set up and send it over to you.
-
I can work with data from nearly any source, including your Student Information System (SIS), Learning Management System (LMS), custom spreadsheets, and assessment platform exports (e.g., IB, AP, State Tests). We will discuss your specific sources during our initial call.
-
Your data is stored within a secure Google Workspace Drive. There is only one person who has access to the files and Workspace (me), so there should be no concerns with people seeing your data or your dashboard.
Additionally, we will both sign an NDA stating that the data will not be shared to anyone other than you and The Datafied Classroom.
If you prefer to keep your data housed on your network, then I will just need an account set up on your network to access the necessary files and software. -
Once the dashboard is complete, you will be given top level access so you can determine who will be able to view the dashboard.
On my end, this is a one-person company. So only I will have access to your data dashboard.
-
MTSS Dashboards: It will depend on the number of data sources and the quality of the data extracts. We can discuss turn around time(s) and deadlines when we meet.
Attendance Reports: The report will depend on the attendance platform and data extract. Generally speaking, it should not take more than 10 business days from receipt of the first data extract.
IB Dashboards: Since the data files are consistent from the IBO, I ask for 5 business days to complete your data dashboard.
Custom Dashboards: This will depend on what is needed and will be discussed in our consultation meeting(s).
-
MTSS and Custom Dashboards: This will vary depending on the quality of data, the number of data sources, and customizations. An invoice will be created and sent to you before work begins.
IB Dashboards: The initial set-up cost is $1,500 USD. This includes cleaning up the data for up to the last 5 years and any customizations that you want.
Annual update cost is $1,000 USD. This entails cleaning the data for the most recent year, removing the oldest year, and adding it to your dashboard.
Please note that I will only retain up to 5 years of data. Additional fees may apply if you want to maintain more than 5 years worth of data on your dashboard.
-
Not at all. While I began by specializing in IB dashboards, I also build visual tools for attendance tracking, MTSS, and student progress data. If your school has data in spreadsheets, I can make it visual and useful.
Ready to get started?
Find the time that works best for you in the calendar below. It will automatically account for any timezone changes that might be between us. If you don’t see a time on there that works, email me to find a different time.